 Kanister
Segregate Controller And Datapath Logs
Kanister uses structured logging to ensure that its logs can be easily categorized, indexed and searched by downstream log aggregation software.
By default, Kanister logs are output to the controller's stderr in JSON format. Generally, these logs can be categorized into system logs and datapath logs.
System logs are logs emitted by the Kanister to track important controller events like interactions with the Kubernetes APIs, CRUD operations on blueprints and actionsets etc.
Datapath logs, on the other hand, are logs emitted by task pods created by Kanister. These logs are streamed to the Kanister controller before the task pods are terminated to ensure they are not lost inadvertently. Datapath log lines usually include the LogKind field, with its value set to datapath.
The rest of this documentation provides instructions on how to segregate Kanister's system logs from datapath logs using Loki and Grafana.
To run the provided commands, access to a Kubernetes cluster using the kubectl and helm command-line tools is required.
Follow the instructions in the installation page to deploy Kanister on the cluster.
Deployments Setup
The commands and screenshots in this documentation are tested with the following software versions:
- Loki 2.5.0
- Grafana 8.5.3
- Promtail 2.5.0
Let's begin by installing Loki. Loki is a datastore optimized for holding log data. It indexes log data via streams made up of logs, where each stream is associated with a unique set of labels.
helm repo add grafana https://grafana.github.io/helm-charts

helm repo update

helm -n loki install --create-namespace loki grafana/loki \
  --set image.tag=2.5.0
Confirm that the Loki StatefulSet is successfully rolled out:
kubectl -n loki rollout status sts/lokiNOTE
The Loki configuration used in this installation is meant for demonstration purposes only. The Helm chart deploys a non-HA single instance of Loki, managed by a StatefulSet workload. See the Loki installation documentation for other installation methods that may be more suitable for your requirements.
Use Helm to install Grafana with a pre-configured Loki data source:
svc_url=$(kubectl -n loki get svc loki -ojsonpath='{.metadata.name}.{.metadata.namespace}:{.spec.ports[?(@.name=="http-metrics")].port}')

cat <<EOF | helm -n grafana install --create-namespace grafana grafana/grafana -f -
datasources:
  datasources.yaml:
    apiVersion: 1
    datasources:
    - name: Loki
      type: loki
      url: http://$svc_url
      access: proxy
      isDefault: true
EOF
Confirm that the Grafana Deployment is successfully rolled out:
kubectl -n grafana rollout status deploy/grafanaSet up port-forward to access the Grafana UI:
kubectl -n grafana port-forward svc/grafana 3000:80Use a web browser to navigate to localhost:3000:
The default login username is admin.
The login password can be retrieved using the following command:
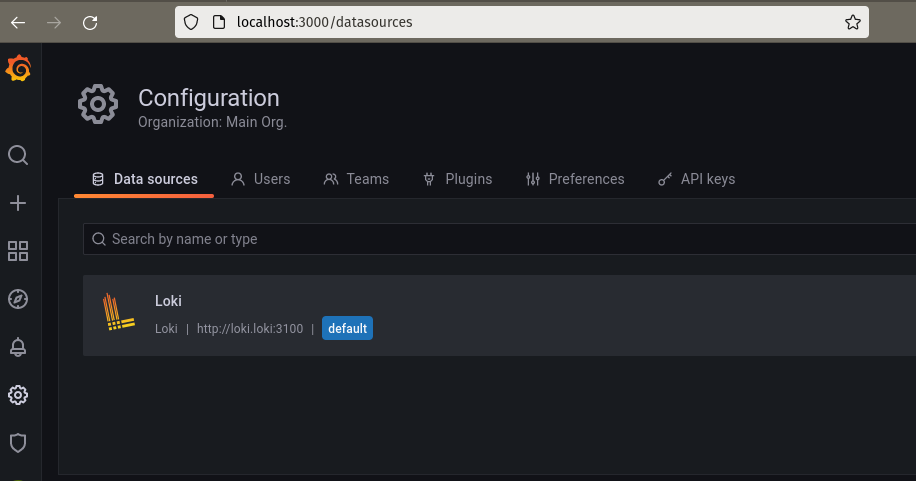
kubectl -n grafana get secret grafana -o jsonpath="{.data.admin-password}" | base64 --decode ; echoNavigate to the data sources configuration under Configuration > Data Sources using the left-hand panel.
Confirm that the Loki data source has already been added as part of the Grafana installation:
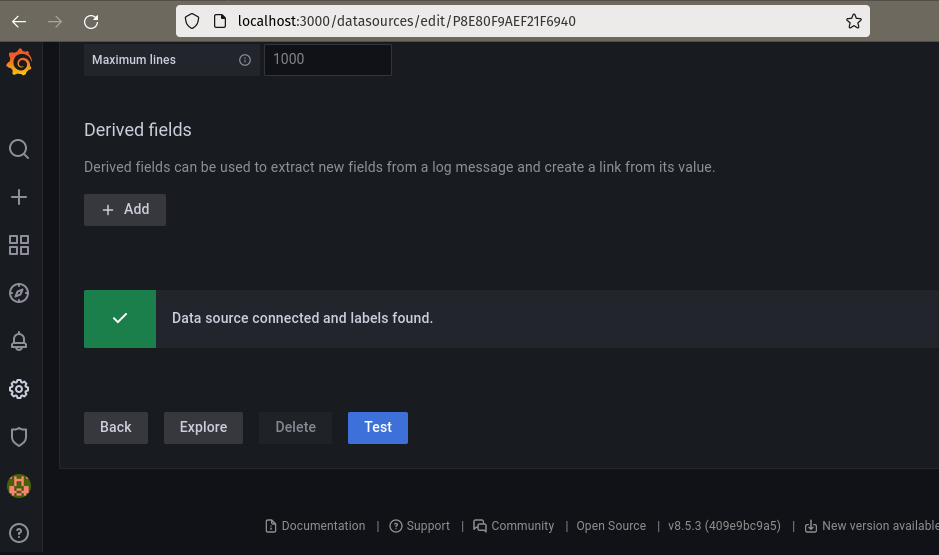
Access the Loki data source configuration page.
Use the Test button near the bottom of the page to test the connectivity between Grafana and Loki:
The final step in the setup involves installing Promtail. Promtail is an agent that can be used to discover log targets and stream their logs to Loki:
svc_url=$(kubectl -n loki get svc loki -ojsonpath='{.metadata.name}.{.metadata.namespace}:{.spec.ports[?(@.name=="http-metrics")].port}')

helm -n loki upgrade --install --create-namespace promtail grafana/promtail \
  --set image.tag=2.5.0 \
  --set "config.clients[0].url=http://${svc_url}/loki/api/v1/push"
Confirm that the Promtail DaemonSet is successfully rolled out:
kubectl -n loki rollout status ds/promtailLogs Segregation
To simulate a steady stream of log lines, the next step defines a blueprint that uses flog to generate Apache common and error logs:
cat<<EOF | kubectl apply -f -
apiVersion: cr.kanister.io/v1alpha1
kind: Blueprint
metadata:
  name: stream-apache-logs
  namespace: kanister
actions:
  flogTask:
    phases:
    - func: KubeTask
      name: taskApacheLogs
      args:
        namespace: "{{ .Namespace.Name }}"
        image: mingrammer/flog:0.4.3
        command:
        - flog
        - -f
        - apache_combined
        - -n
        - "120"
        - -s
        - 0.5s
EOF
Create the following actionset to invoke the flogTask action in the blueprint:
cat<<EOF | kubectl create -f -
apiVersion: cr.kanister.io/v1alpha1
kind: ActionSet
metadata:
  generateName: stream-apache-logs-task-
  namespace: kanister
spec:
  actions:
  - name: flogTask
    blueprint: stream-apache-logs
    object:
      kind: Namespace
      name: default
EOF
Head over to the Explore pane in the Grafana UI.
Ensure that the Loki data source is selected.
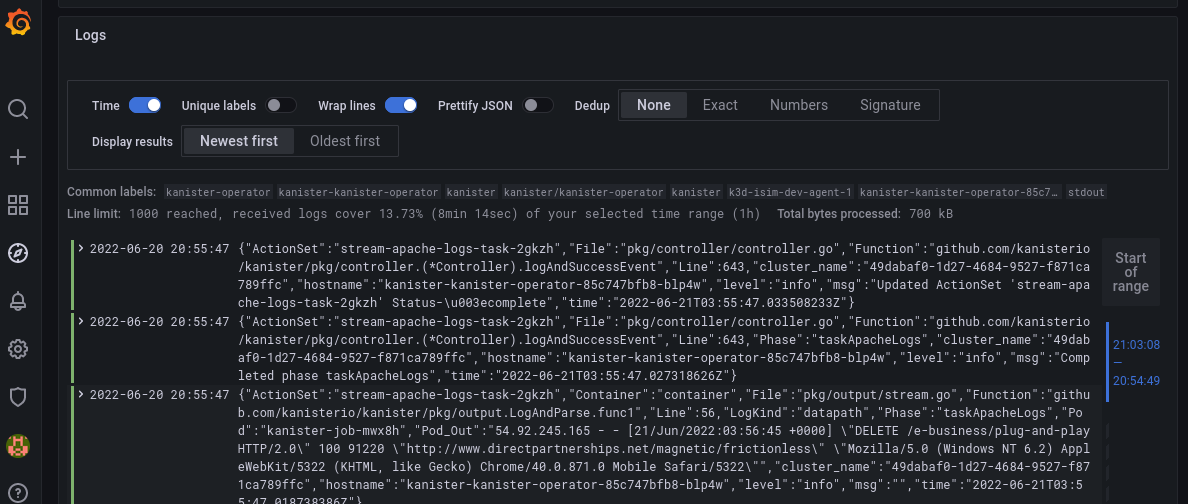
Enter the following LogQL query in the Log Browser input box to retrieve all Kanister logs:
{namespace="kanister"}The log outputs should look similar to this:
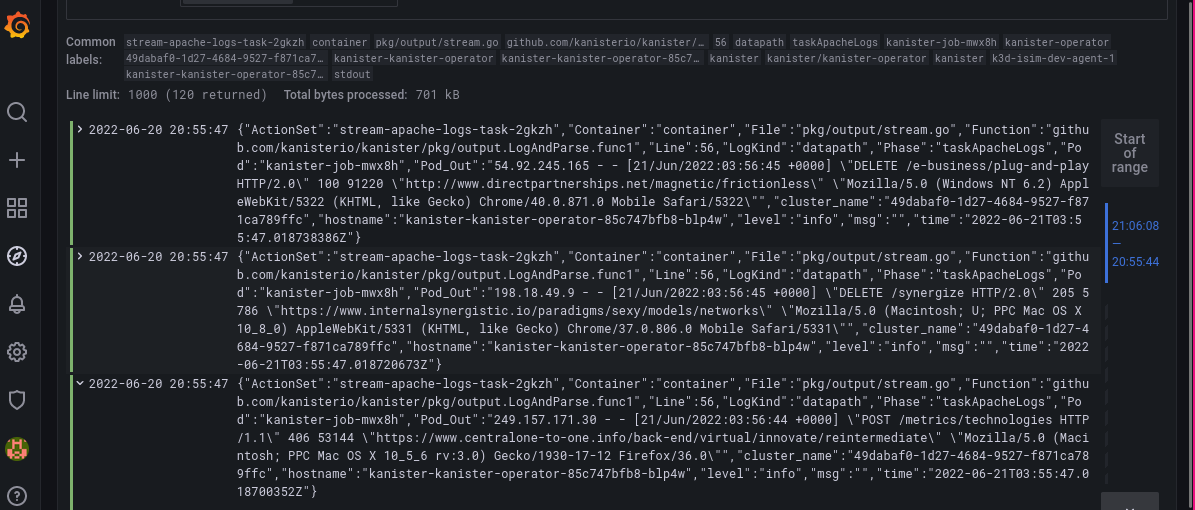
Use the next query to select only the datapath logs, replacing ${actionset} with the name of the recently created actionset:
{namespace="kanister"} | json | LogKind="datapath",ActionSet="${actionset}"The Logs pane should only display Apache log lines generated by flog:
LogQL is a very expressive language inspired by PromQL. There is so much more one can do with it. Be sure to check out its documentation for other use cases that involve more advanced line and label filtering, formatting and parsing.
Wrap Up
As seen in this documentation, Kanister's consistent structured log lines allow one to easily integrate Kanister with more advanced log aggregation solutions to improve ensure better observability within the data protection workflows.
To remove Loki, Grafana and Promtail, use the following helm commands:
helm -n grafana uninstall grafana

helm -n loki uninstall promtail

helm -n loki uninstall loki